
Autumn CO2 Stability Check for Black Beard Algae
BBA does not prove a CO2 problem. Use fixed-event pH and one standardized 15-second flow marker to test delivery before changing the dose.
Marcus Hale · Published 2026-08-27 · 15 min read

Key Takeaways
- When BBA appears in an injected tank, check CO2 stability before raising the dose.
- Cooler water can dissolve more CO2, not less, but only measurements can show whether delivery has become unstable.
- Read pH at four fixed CO2 and light events, then compare the same event across three days.
- Compare one identical flow marker at the BBA hotspot and an unaffected point at the same depth, using sustained displacement rather than swing counts.
- Stabilize measured variables first, remove visible algae last, and use any chemical only as its own label directs.
Your planted tank sailed through summer clean, and now dark tufts are creeping onto the spray bar and the oldest leaves. Nothing obvious changed. The room just got cooler.
That seasonal shift can change temperature demand, evaporation, water level, and maintenance timing. A BBA outbreak makes the delivery pattern worth checking, but the algae alone does not prove that CO2 changed or caused it.
The useful response is diagnosis rather than a larger dose. I test whether the daily CO2 profile and local flow still repeat, correct only the variable that fails, and then watch for new tufts.
What Black Beard Algae Is and Why CO2 Stability Is Worth Checking
Black beard algae is a red alga, not a green one, and that identity explains most of its behavior.
It belongs to the division Rhodophyta and is usually placed in the genus Audouinella.
A damaged tuft may flush red or pink as its red-algal pigments become visible, but that color is only a screening clue.
It does not identify a genus or exclude every lookalike, so the defensible identification stays at the red-algae level unless microscopy or genetic identification says more.
That red-algae biology is why BBA grips so hard. It anchors with a holdfast to stable, well-lit, high-flow surfaces like hardscape, filter outlets, and old leaf margins.
You rarely wipe it off. You scrub it, oxidize it, or lose the leaf.
BBA alone does not prove that CO2 is low or unstable, but recurring tufts in an injected tank are a reason to compare delivery at fixed times. A tank can show an adequate reading once and still hide a within-day or day-to-day swing.
Why I Test Fluctuation Instead of Assuming Low CO2
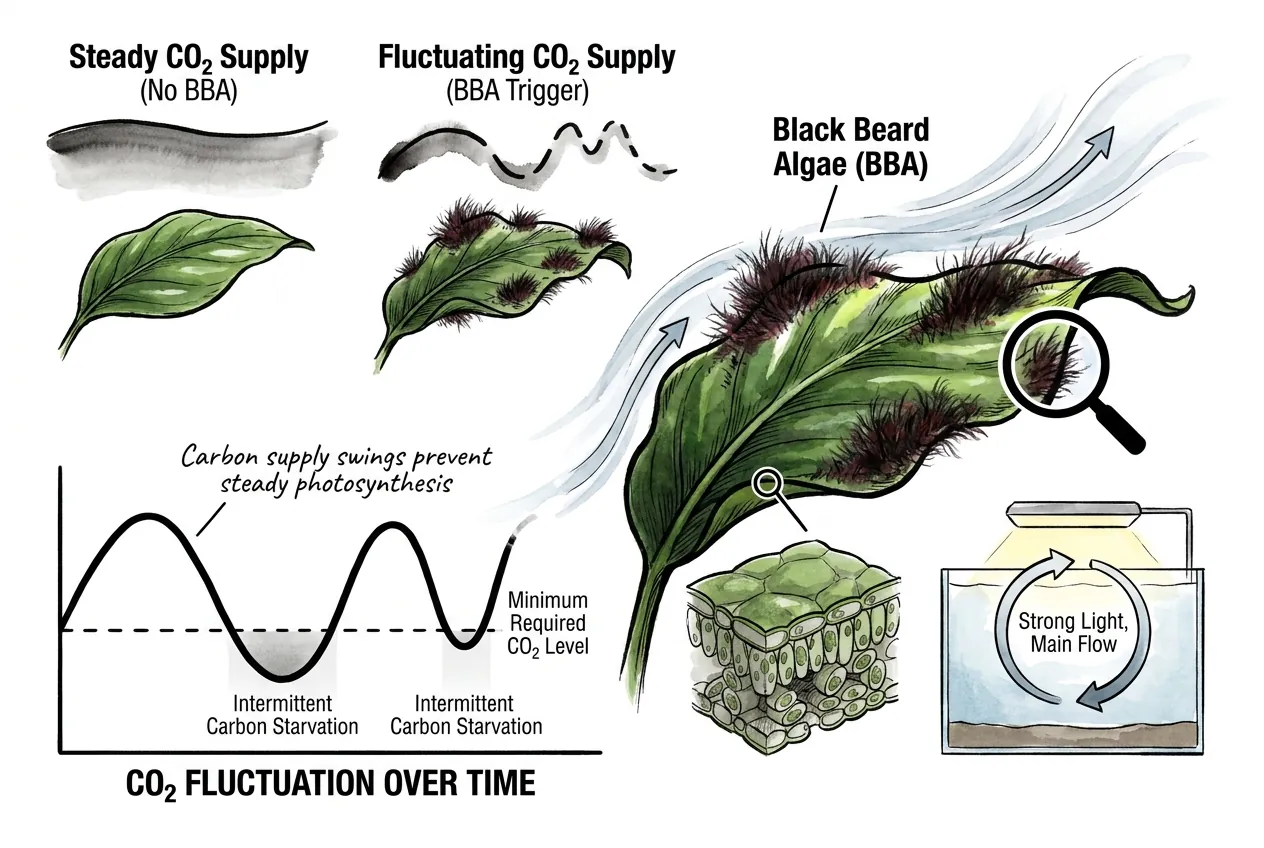
An unsteady carbon supply can leave well-lit plants carbon-limited during part of the photoperiod and reduce their growth.
That makes repeatability worth testing, but it does not identify the cause of BBA by itself.
The location of the first tufts is still a useful comparison point. Record its light exposure, leaf condition, and local movement, then compare those with an unaffected area.
The location does not prove whether flow is too high or too low, but it tells you where the fixed checks belong.
How Cooling Water Actually Changes CO2
At the same gas pressure, cooler water can hold more dissolved CO2, not less. This surprises keepers who assume any autumn cooling automatically starves a tank of carbon. Gas solubility rises as temperature falls, the same reason a cold soda keeps its fizz longer than a warm one.
Solubility therefore cannot establish the diagnosis. If the tank water actually cools, capacity rises and plant demand may fall. If the heater holds the same temperature, neither follows merely because the room became colder. Delivery becomes unstable only when injection, flow, gas exchange, water level, or timing also stops repeating.
Autumn does not lower how much CO2 the water can hold, so blaming cold water for a carbon shortage sends you fixing the wrong thing.
Slower Metabolism Lowers Plant Demand
If the water temperature falls, plant metabolism and carbon demand can also fall. Photosynthesis is temperature-dependent, and carbon-fixation enzymes work more slowly as water cools within the tropical range.
A tank that actually runs cooler may therefore need a fresh profile instead of its summer assumption.
If injection stays fixed while uptake drops, dissolved CO2 may run higher than before. Watch for fish gathering at the surface or a drop checker that reaches yellow later in the day, stop increasing the dose, and verify the pH profile before changing anything else.
Why the Combination Can Expose Instability
The relevant effects act on different timescales. Solubility responds physically to temperature, metabolism responds biologically, and surface gas exchange follows flow and agitation.
Those differences do not guarantee an erratic curve. They explain why I measure the same equipment events for several days instead of inferring a swing from the season or the algae.
Autumn Variables Worth Checking in a Planted Tank
Autumn can expose weak controls through several small changes that stack. A cooler room, a harder-working heater, a drifting water level, and a slipping maintenance schedule are candidates to test rather than assumed causes.
None proves a CO2 swing alone. I record each one so the pH profile can be compared with an actual equipment or routine change.
The Heater Cycles Harder in a Cooler Room
When the room cools, the tank loses heat faster, so the heater runs longer to hold its setpoint. Heater runtime alone does not prove a CO2 change.
I record actual water temperature beside the pH readings. Only a measured temperature drift gives me a reason to treat temperature as part of the carbon change.
A marginal heater in a cold room swings more around its target. Size and place the heater so it holds temperature steadily rather than lurching between cycles.
A Drifting Water Level Increases Off-Gassing
Drier heated indoor air changes evaporation, so the water level falls further before each top-off. A lower level increases the drop from the filter outflow to the surface, which raises splash and agitation. More surface agitation means faster CO2 off-gassing.
That produces a weekly rhythm the plants feel. The tank off-gasses more late in the week, just before top-off, then settles after you refill.
Keep the level steady with regular top-offs so surface behavior stops drifting.
Shorter Days and Busier Schedules Add Variability
Shorter daylight and busier autumn weeks stretch out water changes and dosing, and tempt timer changes.
Each maintenance action resets the tank chemistry, so irregular spacing leaves the tank away from its baseline more of the time.
Hold the timer, water-change, and dosing schedule steady through the season change.
Measuring CO2 Stability at Home Without a Meter
You do not need a CO2 meter to catch the swing. At a fixed carbonate hardness, pH tracks dissolved CO2 because carbonic acid from CO2 is the main variable acid in the water. A cheap pH pen becomes a stability gauge.
The relationship is logarithmic, so small pH moves mean large CO2 moves. A drop of about one full pH step corresponds to roughly a tenfold change in CO2.
At 3 dKH, pH 6.6 sits near 22.6 ppm CO2 while pH 6.2 sits near 56.8 ppm.
| pH at 3 dKH | Approx. dissolved CO2 |
|---|---|
| 7.0 | 9 ppm |
| 6.6 | 22.6 ppm |
| 6.2 | 56.8 ppm |
| 6.0 | 90 ppm |
Read the Drop Checker as a Lagging Gauge
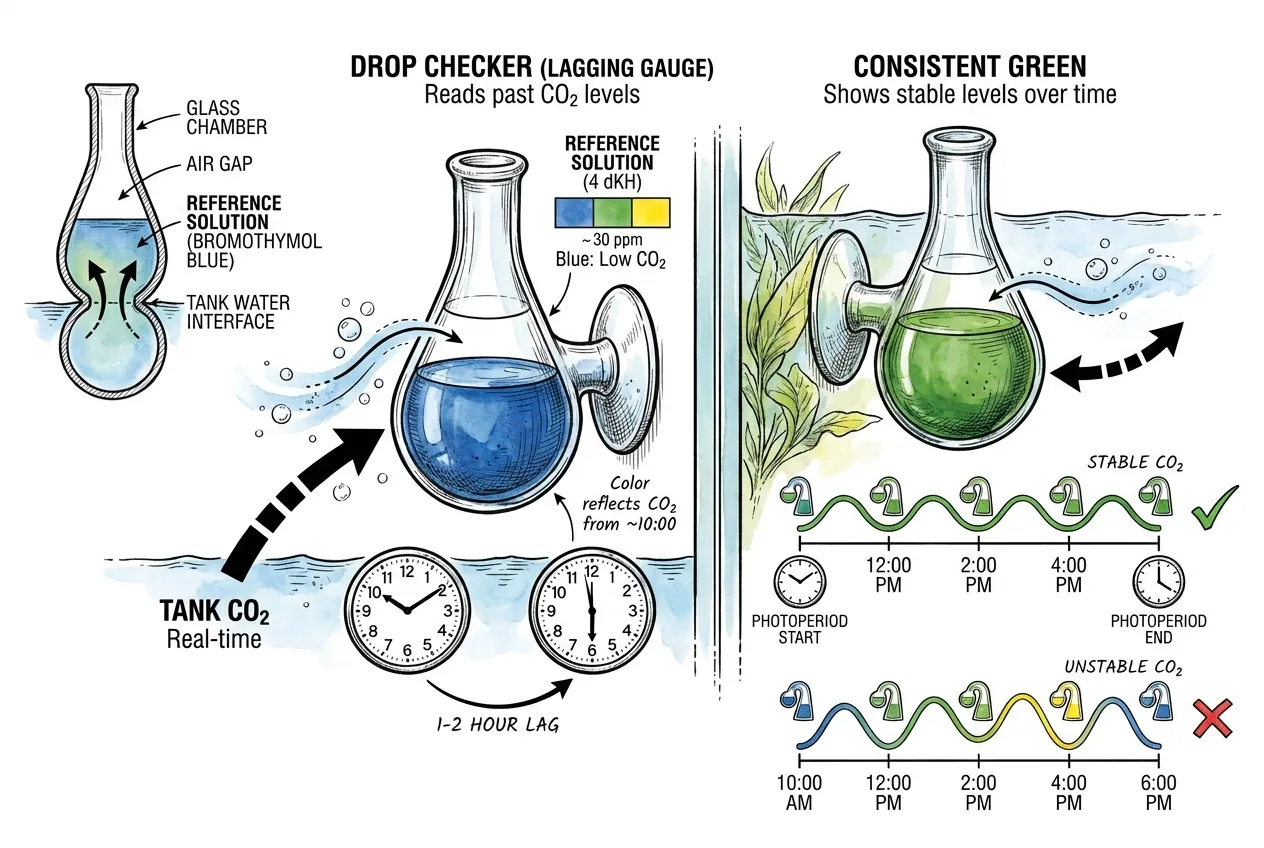
A bromothymol-blue drop checker reports the past, not the present. It lags real tank CO2 by roughly one to two hours because CO2 must diffuse across an air gap into its reference solution before the dye responds.
A 4 dKH reference reading green corresponds to about 25 to 35 ppm CO2.
So the useful question is not whether the checker is green at one glance. Compare its color at the same point in the schedule for several days. A checker that never reaches green may indicate consistently low delivery or simple indicator lag. Instability shows up when the same-time color keeps changing.
The CO2-Timer pH Profile That Exposes a Swing
Here is the measurement I rely on to separate an unstable schedule from one that is simply set low.
I calibrate the pen with pH 4 and pH 7 buffers before the series, then use the same mid-water spot for every reading.
I take four readings tied to equipment events. They fall immediately before CO2 turns on, immediately before the lights turn on, halfway through the photoperiod, and immediately before CO2 turns off.
Those events stay comparable even when the seasonal sunrise moves. I log them for three consecutive days while keeping KH, bubble rate, surface flow, and both timers unchanged. If KH changes, I start a new baseline.
For each event, my day-to-day tolerance is whichever is larger, either 0.10 pH or twice the pen’s stated accuracy.
A pen rated at plus or minus 0.05 pH therefore uses 0.10, while a plus or minus 0.10 pen uses 0.20.
After three days I use the median reading for that event as the reference. I call the profile unstable only when two of the three readings differ from that median by more than the allowance.
If only one reading falls outside the allowance, I treat it as an unresolved outlier and repeat that event on day 4 without changing the tank.
I then use the midpoint of the two previously agreeing readings as the reference and call instability only if day 4 also falls outside its allowance. This keeps one poor reading from triggering a CO2 adjustment while still exposing a repeatable drift.
I do not require a one-step pH drop to pass this stability test. A full step describes a large concentration change, not repeatability, and non-carbonate acids can shift the absolute estimate. The tank first needs a livestock-safe profile that repeats. Only then is there a reason to consider a gradual delivery change.
When the profile says the tank is unstable, I stabilize delivery, timing, and flow before I add any more CO2.
One caution keeps the reading honest. Nitric and organic acids also lower pH, so the absolute ppm from a KH-pH table can read high.
The repeated same-event profile is useful for stability even when the absolute CO2 number is off.
The whole check is passive, so there is no CO2-handling hazard. Keep the pen and its cable clear of live outlets and use GFCI protection near the tank.
Flow, Surface Agitation, and the Dead Spots Worth Testing
Injected CO2 only helps a leaf if flow carries it there. Two problems undo good injection.
Surface agitation continuously off-gasses CO2 back to the air, and weak flow leaves microzones that get carbon only intermittently.
When BBA clusters in one of those zones, the distribution gap is worth ruling out before the dose changes.
Keep Surface Agitation Only as Strong as You Need
More surface turbulence renews the air-water interface faster, so an injected tank loses CO2 more quickly and needs more injection to hold the same level.
Set agitation for oxygen and surface-film control, not for maximum movement. Excess splash quietly fights your CO2, and a dropping water level makes it worse.
The Standardized Motion Audit That Finds Obvious Dead Spots
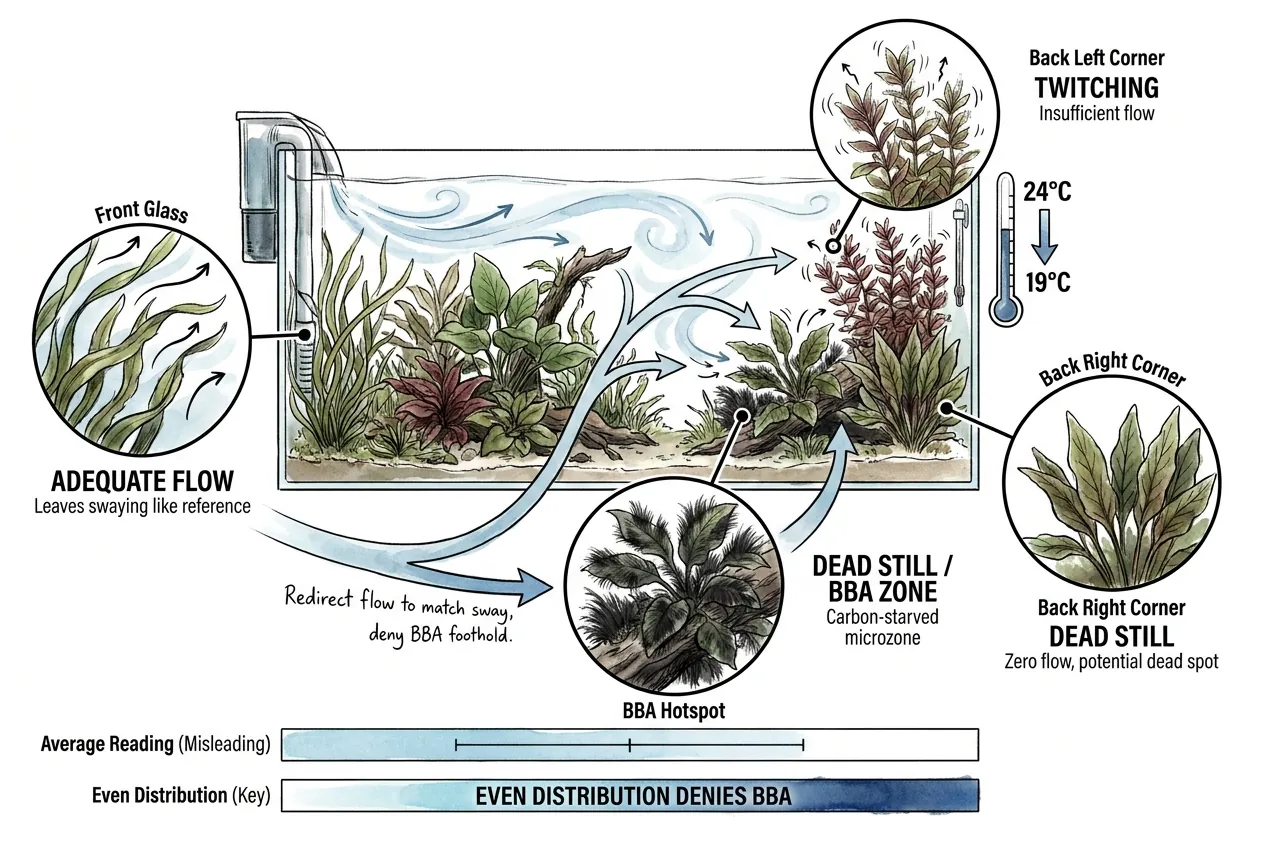
Leaves show me where to look, but they are a poor measuring tool because a stiff Anubias leaf and a thin stem can sit in the same current and move differently. I use one marker at every location.
I cut a 5 by 40 millimeter strip from a clean, unused polyethylene food bag, clamp 10 millimeters in long aquascaping tweezers, and leave the same 30 millimeters free for every reading. That free length is my working size because it remains visible while staying short enough to control near plants and equipment.
I choose an unaffected comparison point at the same depth as the BBA hotspot and with similar clearance from nearby leaves or hardscape. I tape a 5 millimeter grid to whichever outside pane gives a square-on view of the marker’s deflection.
With lights on and flow running normally, I hold the clamp still for 5 seconds, then record how many of the next 15 seconds the free tip stays at least one grid square away from the vertical projection of the clamp. If the tip moves toward or away from the camera, I restart from the adjacent pane so depth movement is not mistaken for no movement.
I run three trials at the comparison point and three at the hotspot, using the median time for each.
A steady current now registers as sustained displacement even when the strip never swings back, while the matched depth and clearance keep the two positions comparable.
My working screen calls a median of at least 10 seconds sustained, less than 5 seconds still or intermittent, and 5 through 9 seconds inconclusive.
The five-second gap is deliberate because it stops small hand movements from flipping the category. This is a within-tank comparison rather than a published flow rate, so I also record the direction of displacement and do not compare the number with another aquarium.
After redirecting flow, I repeat the three hotspot trials and stop once the median reaches at least 10 seconds without fish struggling or nearby leaves being pinned in one direction.
I keep hold of the strip, remove it after the test, and keep it clear of intakes and impellers. This remains a distribution check rather than proof of a particular CO2 concentration.
Only after the hotspot leaves the still-water category do I judge whether CO2 dosing itself is the problem.
A repeated marker result tells me whether the hotspot receives circulation. It does not tell me why BBA grew there. Keep hands and tools clear of impellers and intakes, and run all in-tank electrical on a GFCI-protected outlet.
Matching Light to a Slower Season
When light outruns the carbon available to plants, plant growth can become carbon-limited even though the fixture has not changed. That imbalance is worth correcting, but it still does not prove why BBA appeared.
If measured water temperature or plant growth falls in the cool season, last summer’s light schedule may now be more than the plants can use.
The realistic home fix is small. Trim the photoperiod modestly, for example by an hour, and lower intensity if your fixture allows, then hold that schedule steady and watch plant response.
You do not need a PAR meter or a lab protocol. A reliable timer and a slightly shorter, consistent day get most of the benefit.
Change one thing at a time so you do not stall the plants. If leaves pale after a big cut, restore the prior schedule and adjust in smaller steps. A one-hour change held for observation is easier to attribute than simultaneous changes to light, CO2, and flow.
The Stabilize-First Recovery Order
Remove the algae after the measurements, not before them. Manual removal clears what you can see, but BBA can return while a contributing condition remains. Correct only the variable that failed its check, then clean.
Work the System in Order
Check in this order, starting with measured temperature, then CO2 delivery, then light, then flow, and only then remove the visible algae.
A stable temperature removes one variable from the pH comparison. A repeatable pH profile and marker result then tell me when to stop adjusting, without claiming that either one caused the outbreak.
Once the pH profile repeats and the hotspot leaves the still-water category, those two measured variables are stable enough to stop adjusting.
Remove the visible algae, keep the settings fixed, and judge success by whether new tufts appear rather than assuming the cause is gone immediately.
When You Reach a Gear Decision
Some fixes point at equipment. A marginal heater, weak circulation, an unreliable CO2 delivery path, or the lack of a decent test kit each undermine stability.
Choose gear by the measurable spec each job needs rather than by brand.
You may be weighing which heater or controller, circulation pump, CO2 delivery method, test kit, or algae-control tool to buy.
Work through the site’s aquarium algae control product chooser to match the spec to the job.
For an established infestation, the deeper walkthrough in how to get rid of black beard algae covers removal step by step.
Liquid Carbon and Its Label Limits
Products sold as liquid carbon vary in formulation and directions, so I do not infer the active ingredient or an algaecide use from the marketing name.
If I use one, I select the exact product first and follow its tank-wide label dose. I do not turn off flow, exceed the stated dose, or apply it directly to algae or plant tissue unless that product’s official label explicitly instructs those steps.
It Does Not Identify the Cause
A chemical treatment can remove visible algae without identifying why it appeared. I therefore keep the measured temperature, pH profile, light schedule, and flow marker unchanged while judging the result.
If the label provides no direct-application method or contact time, I do not invent one from a forum procedure.
Some Plants and Invertebrates Are Sensitive
A product that suppresses algae can also harm plants or livestock when concentrated or misapplied. Check the official compatibility guidance for the exact product and every species in the tank. If the manufacturer warns against direct application or identifies sensitive plants, do not substitute a hobby spot-treatment recipe.
Chemical cleanup and causal diagnosis are separate jobs. Use only a labeled method for the first and repeated measurements for the second.
Key Takeaways
- BBA does not prove a CO2 problem, but an injected tank should be checked for repeatable delivery before the dose rises.
- Cooler water can dissolve more CO2, but autumn alone does not prove that delivery became unstable.
- Read pH at four fixed CO2 and light events, then compare each event against the day 1 baseline for two more days.
- Compare sustained marker displacement at the hotspot with an unaffected point at the same depth before changing the CO2 dose.
- Correct only a variable that fails its check, remove visible algae last, and use chemicals only by the exact product label.